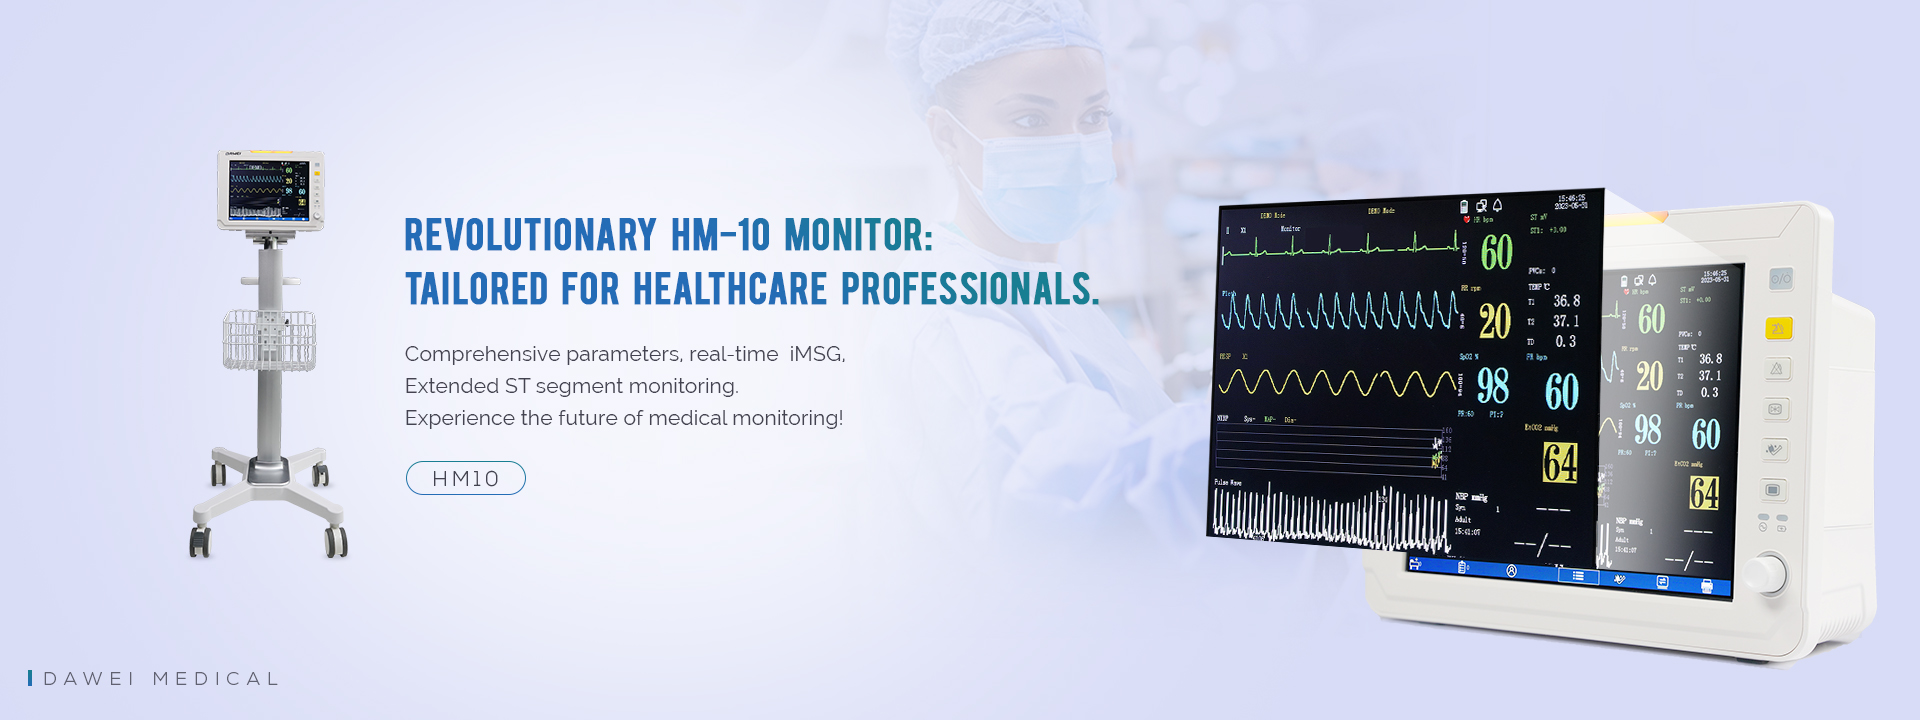
With the continuous advancement of modern medicine, patient monitors, as essential equipment in hospitals at all levels, are widely used in ICU, CCU, anesthesia, operating rooms, and clinical departments. They provide crucial information about patients' vital signs to healthcare professionals, enabling comprehensive patient monitoring.
So, how do we interpret the parameters of a patient monitor? Here are some reference values:
Heart rate: The average heart rate for a normal person is around 75 beats per minute (between 60-100 beats per minute).
Oxygen saturation (SpO2): Normally, it ranges between 90% and 100%, and values below 90% may indicate hypoxemia.
Respiratory rate: The normal range is 12-20 breaths per minute. A rate below 12 breaths per minute suggests bradypnea, while a rate above 20 breaths per minute indicates tachypnea.
Temperature: Typically, temperature is measured one to two hours after surgery. The normal value is below 37.3°C. After surgery, it may be slightly higher due to dehydration, but it should gradually return to normal as fluids are administered.
Blood pressure: Blood pressure is generally measured one to two hours after surgery. The normal range for systolic pressure is 90-140 mmHg, and for diastolic pressure, it is 60-90 mmHg.
In addition to comprehensive parameter display, patient monitors offer various interface options for healthcare professionals. The standard interface is the most commonly used, providing a balanced presentation of all parameter information for convenient clinical monitoring. The large-font interface is useful for ward monitoring, allowing healthcare providers to observe patients from a distance and reduce the need for individual bedside visits. The seven-lead simultaneous display interface is particularly beneficial for cardiac patients, as it enables simultaneous monitoring of seven waveform leads, providing more comprehensive cardiac monitoring. The customizable interface allows personalized selection, allowing healthcare professionals to adjust parameters' colors, positions, and more, to meet different clinical needs. The dynamic trend interface enables real-time analysis of physiological trends, particularly suitable for patients requiring continuous monitoring for more than four hours, providing clear graphical representation of their physiological status.
Of special note is the IMSG feature, which displays the actual oxygen saturation digital signal in real-time, providing direct reference to the influence of ambient light on oxygen saturation measurement.
As an outstanding product, the HM10 patient monitor has a unique design when it comes to dynamic trend graph analysis. The dynamic trend graph is incorporated within the parameter module, enabling healthcare professionals to perform rapid analysis of trends, promptly understanding changes in patients' physiological conditions. Whether it is the interface combination of the basic patient monitor or the innovative data presentation, the HM10 patient monitor demonstrates its exceptional performance and unwavering commitment to medical care.
Post time: Jun-20-2023


